The North Korean Nuclear Test Program
For those interested in determining the strategic threat posed by North Korea, it is essential to know just how powerful the nuclear weapons are that they have developed. So far since their nuclear test program started, they have carried out a total of 6 underground tests. All conducted between 2006 and 2017 at their primary test site in Purgye-ri.
Now even without direct knowledge of the design specifications of each of their nuclear devices, it is still possible to determine their yield values in terms of TNT. This being due to the fact that any given surface or sub-surface nuclear test will produce a distinct seismic signature, which will be picked up by various monitoring stations around the world.
Inside, although the primary function of seismic monitoring stations is to register natural earthquakes, they are more than capable of also detecting nuclear explosions. And given this fact, it is practically impossible to hide a nuclear test program.
It is well to note then that there is a definite correspondence between the strength of a given seismic signature, and the yield of a nuclear weapon as would be required to produce it. To be sure, from the multitude of tests conducted over the years by the various nuclear powers, a whole series of equations have been developed linking seismic signatures to nuclear yields.
Herein one may consider then the seismic signatures of all 6 nuclear tests so far conducted by North Korea, as sourced from the official USGS website ( US Geological Survey ):
4.3 - Nuclear Explosion: 2006-10-09 01:35:28 ( UTC )
4.7 - Nuclear Explosion: 2009-05-25 00:54:43 ( UTC )
5.1 - Nuclear Explosion: 2013-02-12 02:57:51 ( UTC )
5.1 - Nuclear Explosion: 2016-01-06 01:30:01 ( UTC )
5.3 - Nuclear Explosion: 2016-09-09 00:30:01 ( UTC )
6.3 - Nuclear Explosion: 2017-09-03 03:30:01 ( UTC )
TNT Yield Values of the North Korean Nuclear Tests
Beginning in 2006 with the very first North Korean nuclear test, a detailed analysis of its seismic signature was conducted using a special formula unique to the composition of the ground about the test site, thus allowing for a determination of the TNT explosive yield of the nuclear blast itself. Over the years this very same formula has subsequently been used to evaluate the remainder of their tests, right up to 2017. The results are given as follows:
The formula thus employed to derive the TNT yield values of the North Korean nuclear tests from their seismic signatures is: Mb = 4.262+0.973 logY.
Now by way of comparison, one may contrast these yield values with those of the first 3 atom bombs used by the United States in 1945. They include the initial Trinity test in New Mexico, followed by the devices used to attack Hiroshima and Nagasaki:
Here it can be seen then from the above table, that with their last nuclear test in 2017, North Korea would appear to have scaled up the power of their devices to some 6 times the yields achieved by the US with Trinity and Nagasaki.
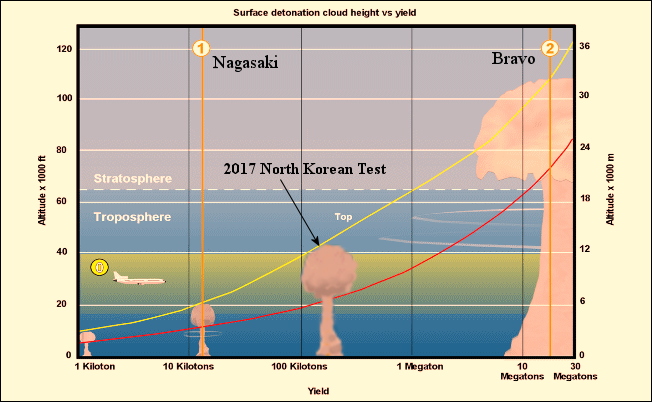
Moreover, to get a feel for the power of their latest device, one may visually compare it ( where it used atmospherically ) to the Nagasaki blast, including also the massive US 15,000,000 tons of TNT test in 1954, code-named Bravo: